Why flood maps disagree
Last checked
When Hurricane Harvey flooded 154,170 homes around Houston in 2017, more than two-thirds of them were outside FEMA’s 100-year floodplain. That’s the short answer to why flood maps disagree. FEMA’s map draws where rivers and the sea are expected to overflow. Newer scores also try to count heavy rain, and they look ahead to a changing climate. So they flag far more homes.
What does FEMA’s flood map actually show?
The high-risk zones on a FEMA map mark land with at least a 1% chance of flooding in any year. That sounds small. Over a 30-year mortgage, FEMA puts it at about a 26% chance of flooding at least once.
Most of the rest is Zone X. Some of it is moderate risk and some of it is minimal. None of it is “no risk.” Our flood methodology page walks through the zone letters.
What does FEMA’s map leave out?
Mostly rain. The zones are drawn from how rivers, lakes and coastlines behave. A downpour that overwhelms the storm drains can flood streets and basements far from any of them. The federal government’s own auditor, the GAO, said in October 2026 that flood zones don’t include all sources of risk, heavy rainfall among them.
The maps also age. The GAO reported in 2026 that, as of early 2020, a single map took an average of seven years to complete. Land gets paved in the meantime, and paved land sends water downhill faster.
It shows up in the claims. From 2014 to 2024, 29% of federal flood insurance claims came from outside the high-risk zones, according to FloodSmart, the government’s flood insurance site.
Why does Harvey come up so often?
Because Harris County counted the flooded homes afterward, house by house. The Harris County Flood Control District found that 68% were outside the 100-year floodplain. About 70,000 were outside the 500-year floodplain too.
The district put it down to rain beyond anything the maps were drawn for, overwhelming drainage. Just over a third of the flooded homes had flood insurance.
What do the newer flood scores do differently?
The one on Redfin listings is First Street’s Flood Factor, a 1-to-10 score. It estimates the chance that water reaches a building over the next 30 years. It counts rain, rivers, high tides and storm surge, and it assumes a changing climate. FEMA’s zones play no part in it.
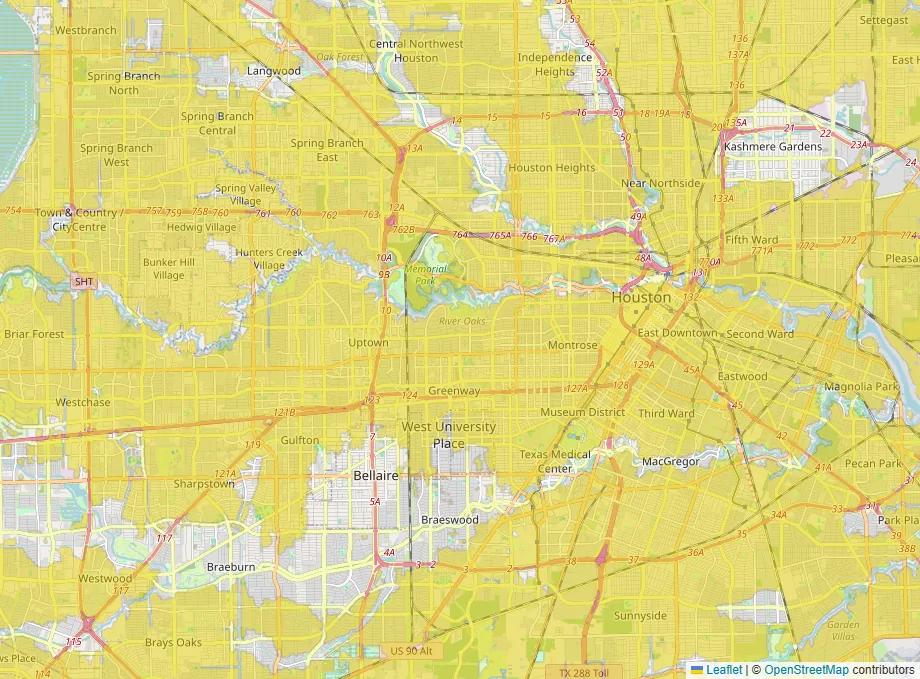
Count homes that way and the numbers jump. As of 2024, First Street rated about 16 million properties at FEMA’s high-risk level or worse. FEMA’s own maps put about 4 million properties in high-risk zones. The GAO found about 13 million of First Street’s high-risk properties sit outside them.
That doesn’t make the newer score right and FEMA wrong. A model of future rain is still a model. First Street itself notes that only FEMA’s maps set insurance requirements and building rules.
Which one decides what I pay?
Both, in different ways.
FEMA’s zone still decides whether you must carry flood insurance. If the home is in a high-risk zone and your mortgage is government-backed, it’s normally required.
The price is a separate question. Since 2021, the federal flood program has priced each home on its own, under a system called Risk Rating 2.0. FEMA says it no longer uses flood zones to set the risk. It looks at heavy rain, distance to water, elevation and what it would cost to rebuild. That means a home outside the zone can still get a real premium, and one inside can get a lower one than you’d expect.
Which map does BelongMaps show?
FEMA’s. It’s the map your lender will use, and it’s public and free. You can see it on the flood map.
That means our layer has FEMA’s blind spot. It won’t show you a street that floods from rain. Treat a clear map as “no mapped river or coastal risk,” not “dry.”
So what should I check for a specific house?
- Look the address up on FEMA’s map, because it decides the insurance rule.
- Get an actual flood insurance quote. It’s the most honest number you’ll find.
- Ask the seller directly whether the home has ever taken water, and get the answer in writing.
- Look at where the house sits relative to the street. Water runs to the lowest spot.
- If a newer score and FEMA disagree a lot, take that as a reason to ask questions, not as an answer.
If you want to see FEMA’s zones for anywhere you’re looking, the flood layer is on the map.