Finding a place with lower disaster risk
Last checked
There’s no such thing as a disaster-free place. Tornadoes have been reported in all 50 states. Floods happen far outside flood zones. The realistic goal is narrower. Pick risks you can see coming, insure against and prepare for. Avoid the ones that are hardest to live with.
Every region trades one risk for another
Leave the Gulf Coast to escape hurricanes and you may move into tornado country. Leave wildfire country and you may land somewhere that floods more. NOAA counted 403 weather and climate disasters costing a billion dollars or more, adjusted for inflation, in the U.S. between 1980 and 2024. In 2025 it stopped updating that list.
So instead of hunting for a place with no risk, compare the specific risks each place carries.
The risks you can map
Each of these is a separate layer you can switch on:
- Flood: FEMA’s flood zones. Read why flood maps disagree first, because heavy rain floods plenty of places outside them.
- Wildfire: built from the Forest Service’s national wildfire data. Land that burned in the last 10 years also counts as risky, because the vegetation grows back. Why wildfire maps disagree explains what it can and can’t see.
- Hurricane: leaves out the coastal areas most exposed to hurricanes. It doesn’t cover inland flooding from the same storms. The Atlantic season runs from June 1 to November 30.
- Tornado: leaves out the areas where tornadoes are most concentrated, based on FEMA data adjusted for county size.
- Earthquake and landslide: shows areas with lower ground-shaking, landslide and sinkhole risk, mostly from U.S. Geological Survey data.
A second opinion from FEMA
FEMA’s National Risk Index scores counties and census tracts across 18 natural hazards. It works differently from our layers. Ours answer yes or no for each hazard. FEMA’s estimates how much damage, in dollars, an area can expect in an average year. It then weighs that against how well the community can cope. It’s a useful way to see how risks add up in one place.
Heat and snow count too
Not every hazard arrives as a disaster. Long heat waves are dangerous, especially for older adults, according to the National Institute on Aging. Heavy snow brings its own costs and risks. The snowfall layer lets you set the range you’re willing to live with.
Insurance is where risk becomes a bill
This is the part that’s easy to underestimate. FEMA’s flood insurance program says most homeowners policies don’t cover flood damage. The California Department of Insurance says standard policies don’t cover earthquakes or landslides either. Each is sold as separate coverage, so a standard policy leaves that risk with you.
And the map doesn’t cover everything. From 2014 to 2024, 29% of federal flood insurance claims came from outside FEMA’s high-risk zones. A clear map lowers the odds. It doesn’t remove them.
The case for not over-filtering
You could switch on every hazard layer and keep only what survives. That’s a reasonable first look, but taken to the end it can push you away from places that would have suited you, for weak reasons.
A house near a flood zone, built high and insured, can be safer than one far from any zone that sits in a low spot. A house in moderate wildfire country with a fire-resistant roof and cleared brush can be better protected than one in a low-hazard area with neither. The house and how you prepare it matter as much as the zone.
So use the layers to rule out the places you couldn’t live with. Then judge the rest house by house.
Before you commit to a house
- Get insurance quotes for that address, including flood and, where relevant, earthquake or wind.
- Ask the seller what the house has been through: past water, past storms, past evacuations.
- Look at where the house sits: low spots, slopes, and how close the brush or the shoreline is.
- Find out how you’d get out, and how you’d hear a warning.
Your starting map
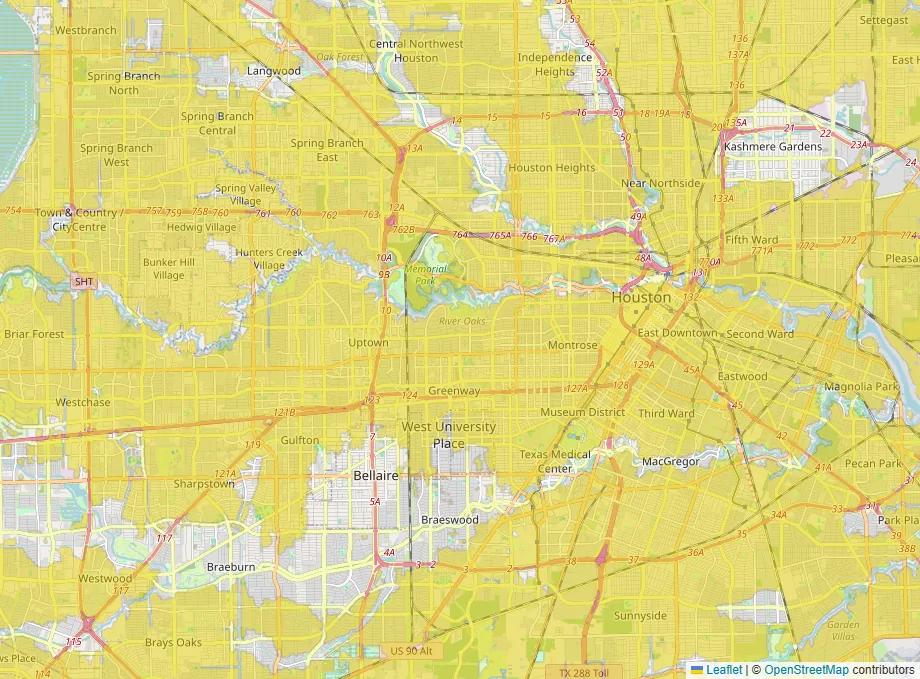
This map opens with flood, wildfire and hurricane risk switched on. Swap in tornado or earthquake if those are the risks that worry you more.