Why wildfire maps disagree
Last checked
A wildfire map looks like an answer to “will my house burn?” None of them answer that. A federal map shows how fire-prone the land is. A state map sets building and disclosure rules. A private score tries to estimate the odds for one property. An insurer’s score feeds your price. Four questions, four maps.
The federal maps describe the land
The U.S. Forest Service publishes two national wildfire datasets. Ours builds on one of them.
Its Wildfire Hazard Potential map shows where a fire would be hard to control, based on vegetation, weather and simulated fires. It is drawn in squares about 270 meters across. The Forest Service says plainly that it is not a map of wildfire risk and not a forecast.
Its Wildfire Risk to Communities project goes a step further. It separates three ideas. Likelihood is the yearly chance a spot burns. Hazard adds how intense that fire would be. Risk adds what is there to lose. Even its “risk to homes” assumes any home a fire reaches is damaged, whatever it’s built from. The project says it isn’t designed for judging individual homes or for insurance.
California’s map is a legal map
California draws its own Fire Hazard Severity Zones: moderate, high and very high. They’re based on vegetation, slope, fire weather and wind. They measure hazard, not risk, so they ignore cleared brush and fire-resistant construction.
What makes them matter is the law attached. A very high zone comes with defensible-space rules and stricter building codes. Sellers must disclose the zone. In 2024 the state redrew the maps for the rural areas where it is responsible for fighting fires. In March 2025 it recommended new maps for areas local fire departments cover, which now include moderate and high zones, not just very high.
One thing these zones do not do is set your premium. The California Department of Insurance says the hazard maps don’t affect insurance rates or availability.
Private scores estimate one property’s odds
The score on Redfin listings is First Street’s Fire Factor, a 1-to-10 rating. It estimates the chance a property burns over the next 30 years, from flames or embers. It simulates a very large number of fires and assumes a hotter, drier climate ahead.
That sounds closest to the question buyers ask. But it’s still a model, and the version you see can change the number. First Street’s own help page and Redfin’s description of the score give different cutoffs for its top band.
Insurers use their own scores
Insurers rate wildfire with their own tools, often licensed from specialist firms. One widely used product, Verisk’s FireLine, looks at vegetation, slope and road access, and it can credit defensible space and other mitigation.
This is the number that most shapes what you pay, and usually the one you never see. California now requires insurers to give you your wildfire score and explain it, and lets you appeal it.
The evidence: maps of land are not maps of losses
The January 2025 Los Angeles fires show the gap in one week. In the Palisades Fire, almost every destroyed home sat in a very high hazard zone. In the Eaton Fire in Altadena, about 83% of destroyed buildings were outside one, under the maps in force at the time.
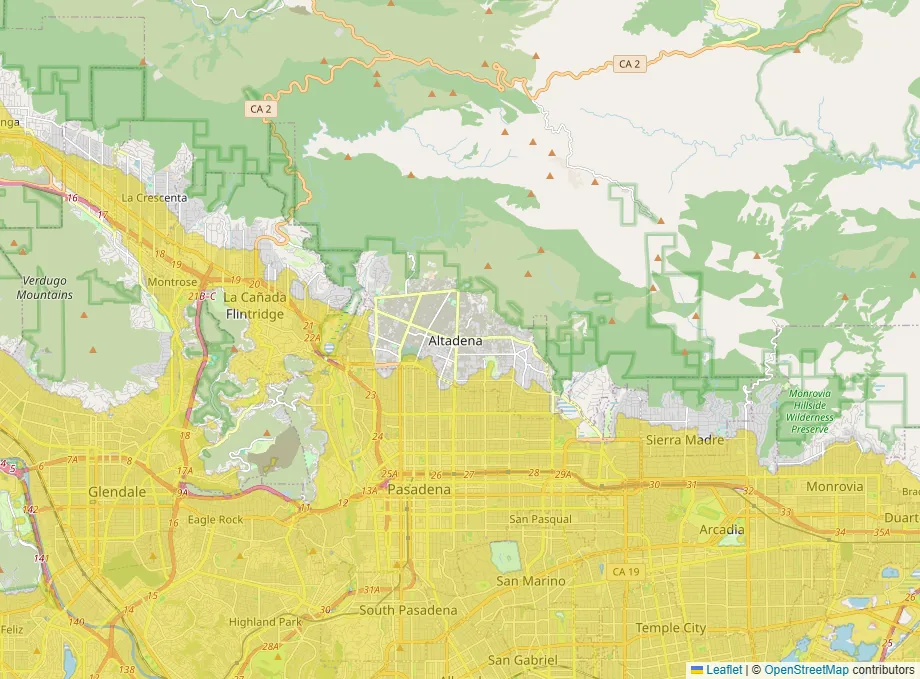
That figure comes from a Los Angeles Times analysis, republished by Firehouse . We checked it against CAL FIRE’s own damage inspections and zone maps and got the same answer. Even on the state’s newer 2025 maps, most of those buildings sit outside any hazard zone at all. The fire burned deep into ordinary suburban streets, and a map of brush and slope was never built to see that.
The case for the land maps anyway
You could reasonably say a map that missed Altadena isn’t worth looking at.
We don’t think that follows. The state’s zones were right about the Palisades Fire that same week. The federal maps cover the whole country on one public definition. And they don’t claim to know your roof. A score attached to one address can look as though it does.
The honest reading is narrower. A high score on a land map is a strong warning. A low score is weaker reassurance than it looks, especially at the edge where homes meet wildland and in very windy places.
What our map shows
Our wildfire layer is built from the Forest Service’s Wildfire Risk to Communities data. It describes the landscape, not your house. Our wildfire methodology page explains what it can and can’t see.
Before you commit to a house
- Get a real insurance quote for that address. It folds in the score that actually matters for your budget.
- In California, ask the insurer for the property’s wildfire score and what would improve it.
- Check the state’s hazard zone, because it sets the rules you’ll live under.
- Look at the house itself: the roof, the vents, and what grows within five feet of the walls.
- Count the roads out yourself. The hazard maps don’t, and the insurer’s score is looking at access for fire crews, not your way out.
The wildfire layer is on the map if you want to see the land around anywhere you’re considering.