Why walkability scores disagree
Last checked
A house listing says “Walk Score 85.” Our map leaves the same block unhighlighted. Both can be right. Walkability scores disagree because they measure different things. Walk Score counts the shops and parks you could reach on foot. The EPA’s walkability index, which our map uses, looks at the street grid, the nearest transit stop and the mix of jobs and homes. Neither one checks whether there’s a sidewalk.
The two scores side by side
| Walk Score | EPA Walkability Index | |
|---|---|---|
| Scale | 0 to 100 | 1 to 20 |
| Scored for | An address. Neighborhood and city rankings are separate | A whole small area, roughly neighborhood-sized |
| Mostly measures | How far you’d walk to groceries, schools, parks, restaurants and shops | How connected the streets are, how close transit is, and how mixed the jobs and homes are |
| Transit | Kept separate, in its own Transit Score | A third of the score |
| Sidewalks | Not listed in its method | Not included. EPA says its street data can’t tell |
| Who makes it | A commercial product, part of Redfin | The U.S. Environmental Protection Agency, free to use |
Read the “mostly measures” row and most disagreements explain themselves. One score asks what’s nearby. The other asks how the area is built.
Walk Score counts what you can reach
Walk Score maps the walking route from an address to nearby places in a set of categories. A grocery store five minutes away earns full points. One fifteen minutes away earns fewer. Anything past a thirty-minute walk earns nothing.
It then adjusts for how the streets feel to walk, using population density, block length and how often streets cross. A 90 or above is “Walker’s Paradise.” Below 50 is “Car-Dependent.”
Redfin bought Walk Score in 2014, and Redfin itself has been part of Rocket Companies since July 2025. You’ll see the number on Redfin’s listings, among others.
The EPA index measures how a place is built
The EPA’s National Walkability Index gives every census block group a score from 1 to 20. A block group is a small area, usually a few hundred to a thousand or so homes. The score blends four things, and EPA publishes the recipe:
- How many street intersections there are. More crossings means shorter, more direct walks. This is a third of the score.
- How far it is to the nearest transit stop. Another third.
- How varied the local jobs are, and how well jobs and homes are mixed. The last third, split between the two.
EPA sorts the result into four bands:
- Least walkable: up to 5.75
- Below average: 5.76 to 10.5
- Above average: 10.51 to 15.25
- Most walkable: 15.26 to 20
Our walkability layer is built on these bands.
EPA’s own example shows the gap
EPA’s user guide picks Main Street in Staunton, Virginia. It has shops, sidewalks and a compact old street grid. EPA calls it very walkable. Its index score is 13.7, a step below the top band, because it ranks at the very bottom on distance to transit.
A score built on distance to shops would put that street near the top. A score that gives transit a third of the weight can’t. Neither is broken. They’re answering different questions.
The opposite happens too. A suburban strip with plenty of stores along a wide, fast road can score well on distance to shops. Whether you’d actually want to walk it is another matter.
Neither one sees sidewalks, crossings or hills
This is the biggest blind spot, and it’s shared. EPA says plainly that its street data has no information on sidewalks. Walk Score’s method doesn’t list them either. Neither mentions busy crossings, hills or whether the walk feels safe.
That gap is real in cities that score well. Seattle’s transportation department says about one block in four in the city has no sidewalk.
Does either one predict how much people walk?
Somewhat, and better than nothing. A 2020 study surveyed more than 33,000 adults. In the least walkable EPA band, 22% walked to get places. In the most walkable, 52% did. In rural areas the link disappeared.
A 2023 study counted walkers on video in 24 neighborhoods. Walk Score lined up with how many people were out walking. The EPA index did not. It’s one small study, but it’s the only direct comparison we found.
Why our map uses the EPA index
It covers the whole country with one public definition, and anyone can check what’s in it. Walk Score is a commercial product. On our walkability layer, an area lights up when its EPA score is in the “above average” band or higher. You choose how high.
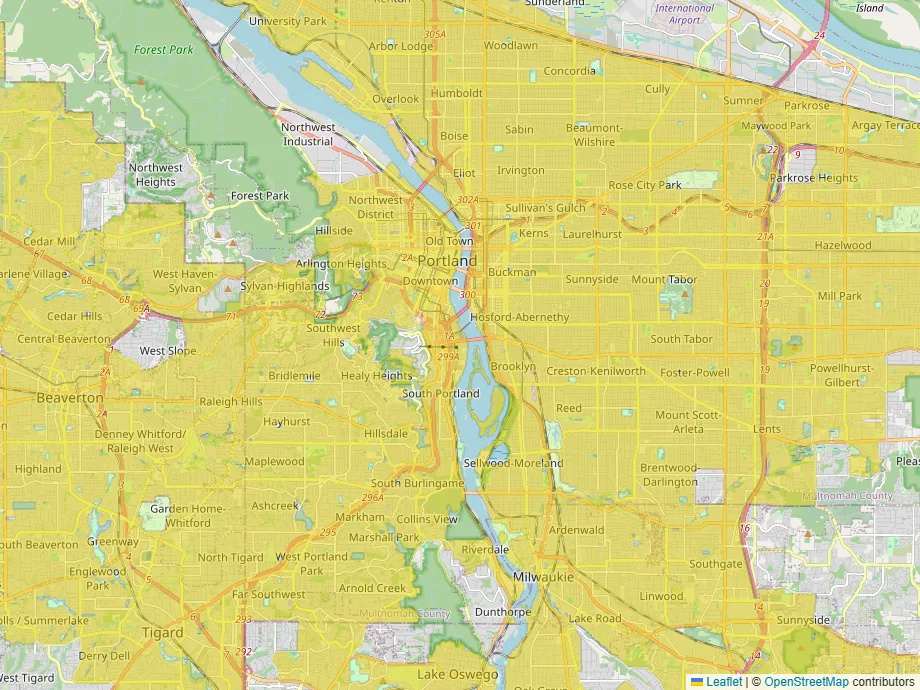
It also comes with the index’s limits. It’s built from data gathered between 2017 and 2020, and EPA hasn’t updated it since 2021. Small towns without transit score lower than they feel. And it knows nothing about sidewalks.
Checking a street before you trust any score
- Walk the route you’d actually take, at the time you’d take it.
- Look at street-level photos for sidewalks on both sides, and for gaps.
- Find where you’d cross the biggest road, and whether there’s a signal.
- If transit matters, check how often it runs, not just whether a stop exists.
- Notice the hills. Neither of these scores counts them for walking.
If you’d like to see which areas score as walkable near you, the walkability layer is on the map.