Living without a car
Last checked
About 1 in 12 American households had no car in 2024, according to the Census Bureau. Owning and running a new car averages $12,863 a year, by AAA’s 2026 count. Where you live decides whether going without is easy, hard or impossible. Here is a week of ordinary errands, and the map layer that answers each one.
Monday: getting to work
Start with transit, because nothing else matters if you can’t get to work. The transit layer shows everywhere within walking distance of a stop. You choose which kinds count: subway, bus, commuter rail, train or ferry. You also choose how far you’re willing to walk.
A stop nearby isn’t the whole story. How often it’s served matters just as much. The transit industry’s planning manual, the Transit Capacity and Quality of Service Manual, makes the point. When a bus or train comes every 10 minutes or better, most riders just show up. At every 15 minutes or worse, most plan their day around the timetable.
Reading a timetable before you move
Look up the routes you’d actually ride and check four things:
- How often it comes at the hour you’d travel.
- When the first trip leaves and the last one returns.
- What changes on Saturdays and Sundays.
- Whether you’d need a transfer, and how long the wait for it runs.
A route that looks fine at 8 in the morning can be hourly by 7 at night.
Tuesday: the grocery run
Carrying a week of groceries is the errand that breaks most car-free plans. The grocery access layer highlights places within a mile of a supermarket in a city, or ten miles in the country. It’s built from the 2019 edition of the U.S. Department of Agriculture’s Food Access Research Atlas. In July 2026 the USDA added a newer version that counts every store taking SNAP benefits and measures driving distance too. Ours doesn’t use that one yet.
A mile is a long way back with heavy bags. If you’ll walk it, look for a store much closer than that, or a bus that stops at both ends.
Wednesday: everything else on foot
Pharmacy, post office, coffee. Whether those are walkable depends on more than distance. The walkability layer uses the EPA’s National Walkability Index. It scores how connected the streets are, how close transit is, and how mixed the jobs and homes are.
It doesn’t measure sidewalks, crossings or safety. Why walkability scores disagree explains what it and Walk Score each miss.
Thursday: the doctor
A routine appointment on transit can take half a day if it means two transfers. The hospital layer shows what’s within a chosen distance of a well-rated hospital. Then check whether a bus actually goes there.
Friday night: getting home late
Many routes run less often in the evening, and some stop altogether. If you work late or go out, check the last trip home, not just the morning schedule.
The weekend: getting out of town
Living car-free doesn’t have to mean never driving. Car-share and rentals cover the occasional trip. If you travel often, the transit layer can include train stations as one of the stop types.
Before you sign a lease
- Do the commute once on transit, at the hour you’d really go.
- Walk to the nearest grocery store and back, carrying something.
- Check the last bus or train home on a weeknight and a Sunday.
- Look at street-level photos for sidewalks along the routes you’ll walk.
Your starting map
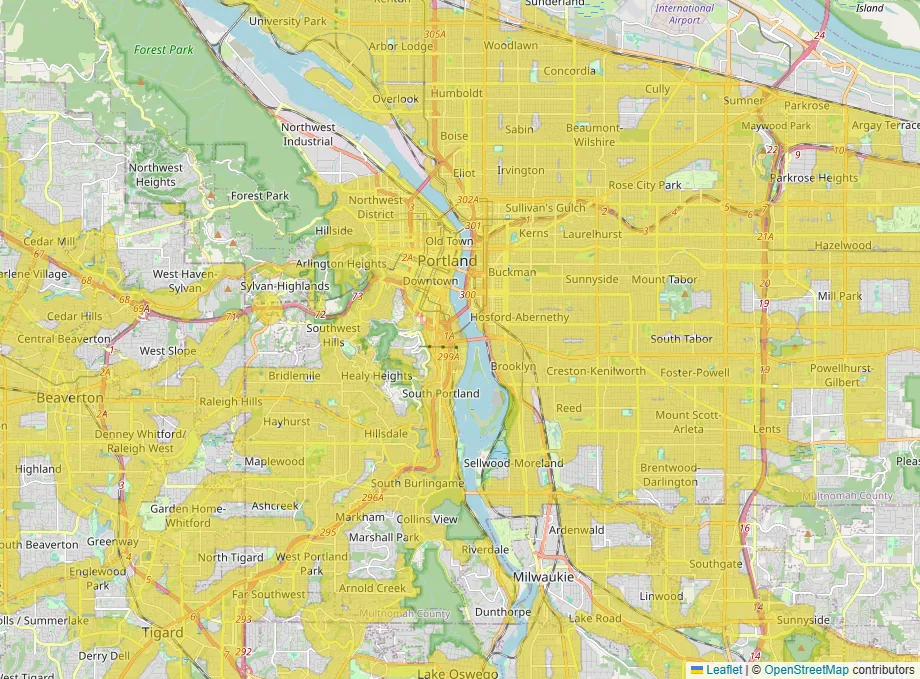
This map opens with transit, walkability and grocery access switched on. Yellow is where all three line up. Then check the schedules for the routes you’d ride.