Why property tax estimates disagree
Last checked
The tax figure on a listing is usually the seller’s bill, and yours may be very different. Property tax depends on the home’s assessed value, your local rate and your exemptions. In several states, including California, Florida and Michigan, the assessment resets when a home sells, and the seller’s exemptions leave with them. That’s why estimates disagree, and why the first bill surprises so many buyers.
The listing shows someone else’s bill
When a listing says “taxes: $3,200,” it is usually reporting what the current owner paid last year. That number reflects how long they’ve owned the home and which discounts they qualify for. Neither transfers to you.
Florida’s Department of Revenue says it outright: many first-time owners are surprised that their bill is higher than the previous owner’s.
How a bill is actually worked out
The basic formula is the same nearly everywhere. Take the assessed value, take off any exemptions, and multiply by the local tax rate. Each of those three parts varies more than people expect.
Assessed value isn’t market value
Some states assess at a set fraction of what a home is worth. South Carolina assesses an owner’s main home at 4% of market value, and second homes at 6%. Others assess at full value but cap how fast it can rise.
California is the famous case. Under Proposition 13, a home’s assessed value can rise at most 2% a year while the same person owns it. When it sells, it’s reassessed at market value, which is usually close to the sale price. The county then sends the buyer a separate “supplemental” bill for the difference.
Florida caps a primary home’s assessment too. The increase is limited to 3% or inflation, whichever is lower. For 2026 the cap is 2.7%. After a sale, the home is reassessed at full market value the next January 1. Michigan works similarly: the cap comes off the year after a home changes hands.
So two identical houses on one street can owe very different amounts. The only difference is when each was bought.
Exemptions belong to the owner
Many states knock some value off for a home you live in. Texas school districts, for example, must exempt $140,000 of a primary home’s value, and $60,000 more for owners who are 65 or older or disabled. A buyer under 65 gets the first exemption but not the second, so their school tax bill will be higher than an older seller’s was.
In many states you have to apply for your own exemptions after you buy. Don’t assume the seller’s carry over.
Extra charges that don’t follow the rate
Some homes carry special district taxes on top. In California, Mello-Roos taxes pay for new-development infrastructure and are set by a formula, not by the home’s value. In Texas, homes in a municipal utility district pay a separate rate, and sellers must give buyers a written notice of it. A simple “local tax rate” won’t show either.
Why estimates on websites disagree
Listing-site calculators usually multiply a price by a typical rate for the area. Redfin’s says your taxes may change after a sale. That gets you in the right range. But it can’t see the cap your home is about to lose, the exemptions you’ll qualify for, or a special district.
Statewide rankings use a different measure again: the effective rate, meaning taxes paid divided by home value. By the Tax Foundation’s 2026 count from 2024 Census data, New Jersey and Illinois were highest at 1.88%. Hawaii was lowest at 0.29%. That figure blends long-time owners with new ones, so a recent buyer in a capped state often pays well above it.
What our map shows
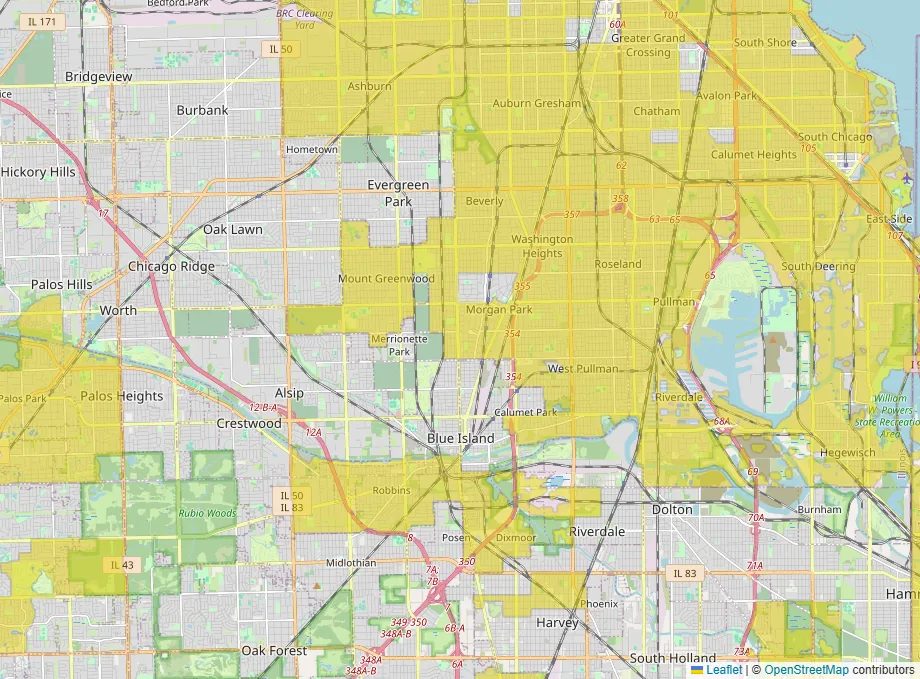
Our property tax layer shows that same kind of effective rate, neighborhood by neighborhood. It comes from Census surveys in which owners report both their taxes and what they think the home is worth. It’s a good guide to how heavy taxes are in an area. Put it next to the home cost layer to see which cheap-looking areas stay cheap once taxes are counted. It is not a quote for any one house, and in capped states it will understate what a new buyer pays.
Getting a real number before you buy
- Look up the home on the county assessor’s or tax collector’s site, not just the listing.
- Ask whether the assessment resets on sale in that state, and estimate the bill at your purchase price.
- List the exemptions you’d qualify for, and when you’d need to apply.
- Ask whether the home sits in any special district, like Mello-Roos or a utility district.
- Ask your lender which tax figure they’re using for escrow. If it’s the seller’s bill, expect your monthly payment to change after the first year.
If you want to compare how heavy property taxes run across neighborhoods, the property tax layer is on the map.