There is no perfect place to live
Last checked
Why stacking every filter on the map leaves nothing at all.
Is there a perfect place to live? We checked, and no. Most of us start a home search with a list. Low crime, no flood risk, a park nearby, good air, a quiet street, an affordable price. Each item is reasonable. Together, they describe a place we couldn’t find.
The experiment
We took 28 of the map’s layers and set each one to a sensible ideal, not an extreme one. Crime at or below 10 reported crimes per 1,000 residents. Public schools in the top fifth. Typical home prices between $200,000 and $1.5 million. Outside high-risk flood, wildfire and hurricane zones. A transit stop and a park or other green space within a short walk. Average noise under 65 decibels, roughly a busy street at a distance. Clean air on most days, a hospital within 15 miles and an international airport within 30. No more than a foot of snow a year.
Then we added them a few at a time and measured how much of the map stayed yellow. We did it around the centers of 30 of the largest U.S. metro areas.
What happened
| Wishes applied | Share of the window still yellow (middle of the 30) |
|---|---|
| 3: crime, flood, wildfire | About 13% |
| 6: plus schools, walkability, price | About 2%; nothing at all in 3 of 30 |
| 12: plus transit, green space, noise, air, hospital, quiet streets | Nothing we could measure in 26 of 30; half a percent or less in the rest |
| All 28 | Nothing we could measure, in all 30 |
By a dozen wishes the map is essentially empty. By 28 there was nothing left we could measure, in any of the 30, even with room in the budget up to $1.5 million.
A few things to know about this test. Each window is about 30 to 40 miles across, around the metro’s center, not the whole metro. The percentage is of everything in the window, water and parkland included. The settings were ours, and a place with no data for one of the layers counts as failing it.
Why it happens so fast
Each filter keeps only part of the map, and the parts don’t line up. Take three wishes from the list: no flood zone, a walkable street, and a price between $200,000 and $1.5 million. Around Boston, they still leave about a third of the view yellow:
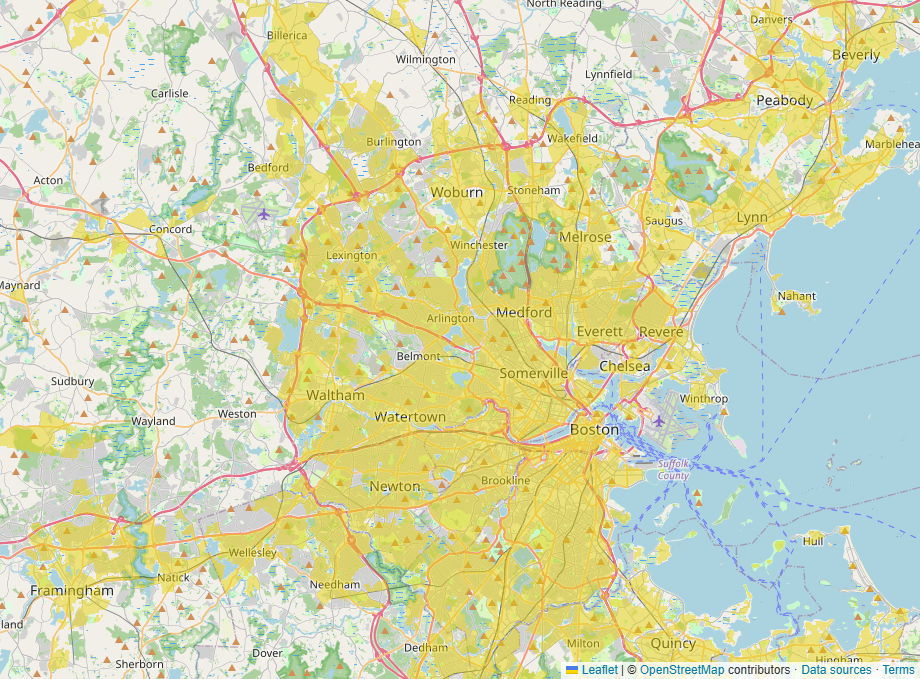
Many wishes also pull against each other. A transit stop and a walkable street often come with traffic and noise. Quiet streets often come with longer drives. Mild coastal weather often comes with hurricane and flood risk. A place that wins on one tends to give up another, so stacking them empties the map.
The fair objection
Nobody actually needs all 28. Most people care deeply about three or four things, and mildly about the rest. That’s the point. The search works when you decide which wishes are requirements and which are preferences, before you open the map.
How to search instead
- Pick your three or four must-haves. Turn only those on.
- Loosen each one a notch and watch how much more of the map opens up.
- Visit the yellow areas and judge the nice-to-haves in person.
- If a wish removes most of what’s left, ask whether it’s worth it.
Our guide to researching a neighborhood covers what to check once you have a shortlist.
Open the map with flood, walkability and price switched on, then add your own wishes one at a time and watch what’s left.