How to read a crime rate
Last checked
A crime rate is the number of reported crimes divided by the number of people who live somewhere. To read one well, check four things. Is it a rate or a count? Who is in the denominator? Is the number big enough to mean anything? And which crimes make it up? A crime rate counts events. It says nothing about the people who live there.
Rate or count?
A count tells you how many crimes were reported. A rate divides that by the population, so a city of a million and a town of ten thousand can be compared. The FBI publishes rates per 100,000 people: in 2025, 327.6 violent crimes per 100,000 nationally. Our map uses rates per 1,000 residents, which are easier to picture. A rate of 15 per 1,000 is 1,500 per 100,000.
Who is in the denominator?
Rates divide by the people who live there, not the people who are there. A downtown, a shopping district or a stadium fills with workers and visitors who aren’t counted as residents. Their crimes are counted; they aren’t. A 2015 study of large U.S. cities found the usual rate overstates risk for cities that draw a big daily population from outside. City rankings changed depending on which population the researchers divided by.
This is one reason the FBI itself tells people not to rank places using its data. It lists factors that make crime differ from place to place, including population density, commuting patterns, climate and how often people report crimes. In its words, rankings ignore the uniqueness of each place.
Is the number big enough?
In a small place, a few crimes move the rate a lot. Three burglaries instead of one triples it. Statisticians treat small counts with care for this reason. The CDC, for example, flags any death rate based on fewer than 20 deaths as unreliable. Look at several years before reading anything into one.
Which crimes are in it?
Most reported crime is property crime: theft, burglary and car theft. In the FBI’s 2025 national figures, property crimes were about 82% of all the crimes it counted. So a total crime rate mostly reflects theft. A place with lots of stores and parking lots can have a higher total for that reason alone.
How crimes are counted matters a little too. The FBI’s newer system records up to 10 offenses in one incident, where the old one counted only the most serious. The FBI found the difference small, because most incidents involve one offense.
What a rate can’t tell you
- It only counts crimes reported to police, and reporting varies.
- It describes an area, not a particular street or house.
- It describes the past, not what happens next.
- It says nothing about the people who live there.
Our page on how we measure neighborhood crime explains how the map handles these problems.
Your starting map
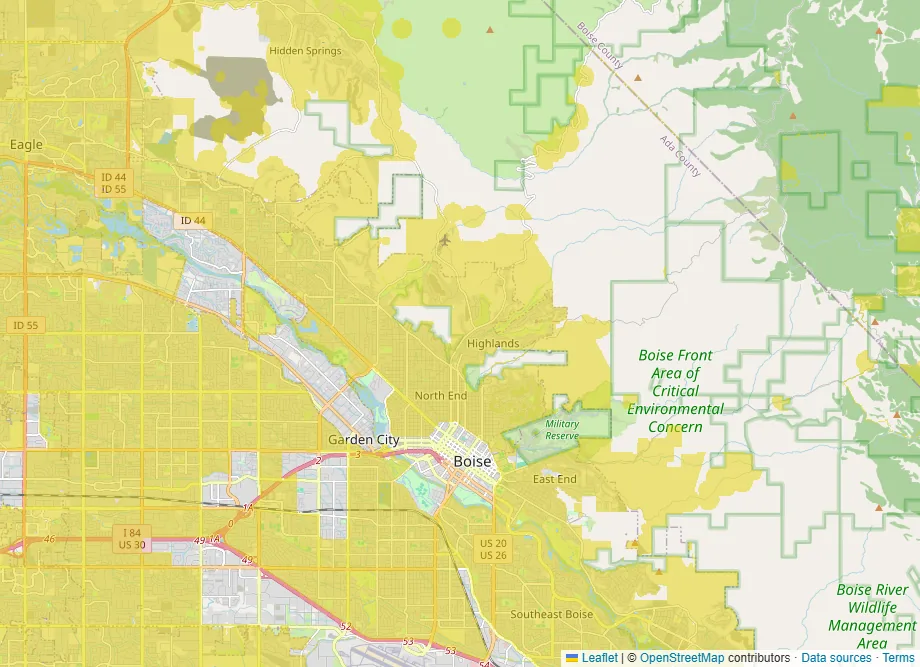
Open the crime rate layer and move the threshold to see how the picture changes.